Consumers increasingly buy online via smartphone
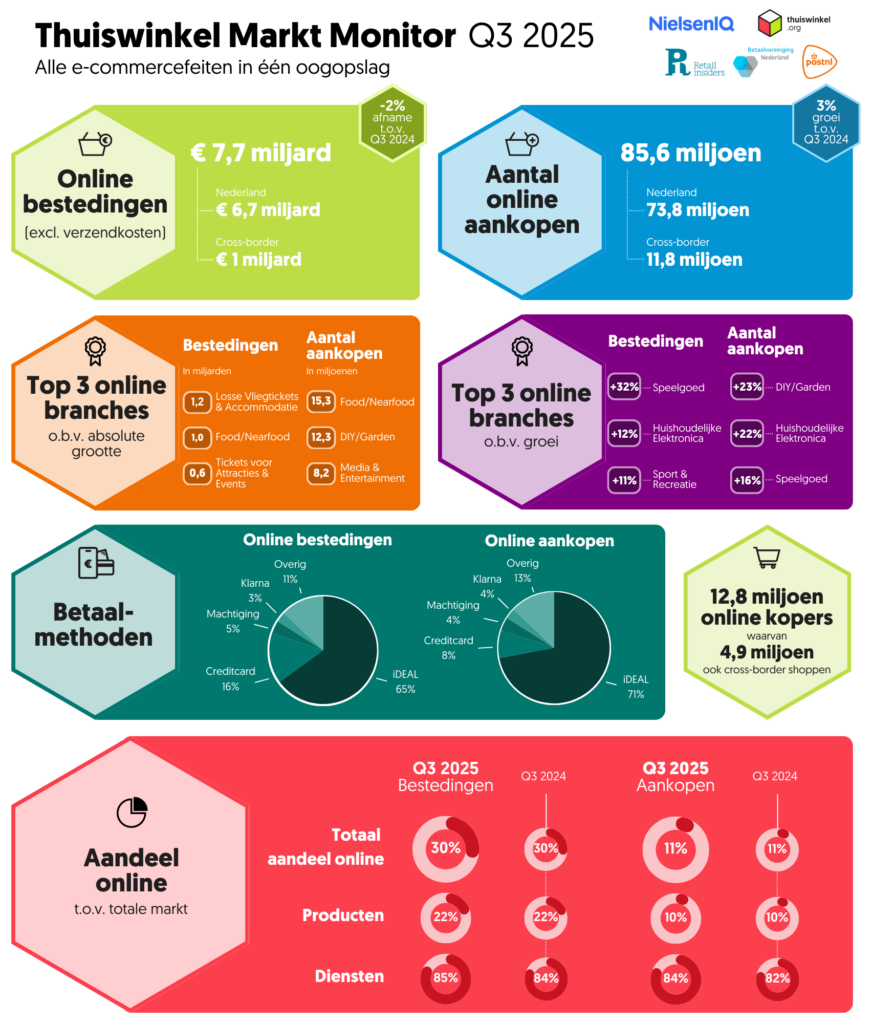
Dutch consumers spent €7.7 billion online in the third quarter of 2025, 2% less than in the same period last year. The number of online purchases increased by 3% to 86 million. The share of purchases via smartphone rose to 43%. This means the share is now equal to that of laptop and desktop. This is according to the latest figures from the Home Shopping Market Monitor, the research into online consumer spending in the Netherlands. This research is conducted by NielsenIQ (NIQ) on behalf of Thuiswinkel.org and Retail Insiders and in cooperation with PostNL and the Dutch Payments Association.

Smartphone use in online shopping as big as desktop/laptop
Both smartphones and desktops/laptops are used in 43% of purchases. Other purchases are made via tablet or other devices such as television. Smartphone use in online purchases has grown strongly in recent years, especially among frequent online shoppers.
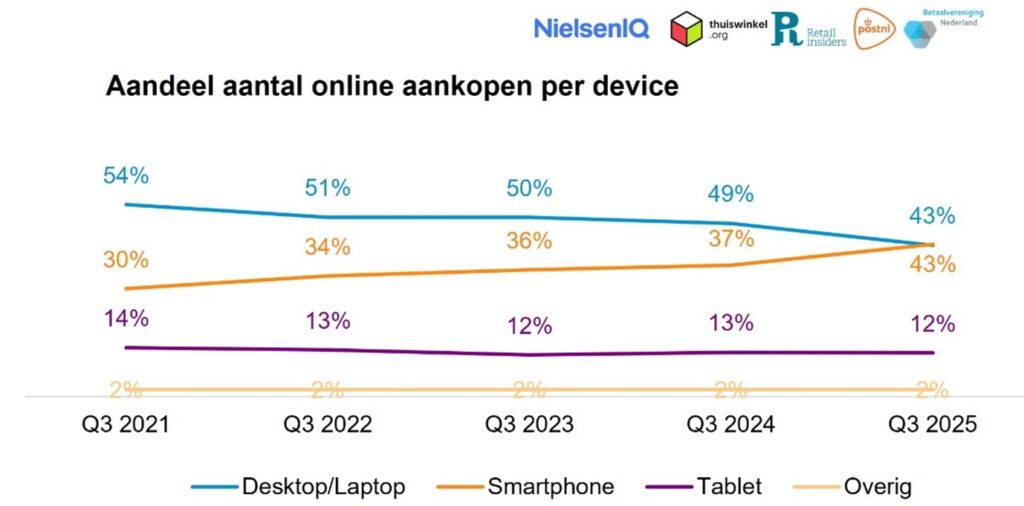
The use of smartphones for online purchases shows a clear increase, especially among Food/Nearfood (from 42% to 53%) and Home & Living (from 28% to 43%). In Food/Nearfood and Clothing (from 47% to 53%), the smartphone is now the most important device for online shopping.
Thuiswinkel.org says: “We know from previous research that the smartphone has already overtaken the laptop in terms of internet use . That online shopping on the smartphone now also seems to become more popular than on the laptop is no surprise to us. Many see webshops on the smartphone becoming increasingly user-friendly. It is important that webshops are aware of this change and adapt their webshops accordingly.”
Decline in spending mainly on services, large differences between product categories
Online spending on services decreases by 6% to €2.7 billion, mainly due to a decrease in spending on Tickets for Attractions & Events and Package Holidays. For both categories, the average amount spent per purchase also decreased sharply (Package Travel -11%, Tickets for Attractions and Events -5%). The number of purchases also decreases within services by 9%, to 12.3 million. Online spending on products increases to €5 billion ( 1%), and the number of purchases rises to 73.3 million ( 5%). Notable is the strong growth within the Toys sector, where both online spending ( 32%) and the number of purchases ( 16%) rise. The average amount spent per purchase is up 13% here.
Cross-border shopping continues to grow
The number of online purchases at foreign webshops grew by 9% to 11.8 million. This increase is due to more product purchases across the border ( 13%). The number of purchases of services from foreign providers actually decreased by 7%. China is strengthening its position: its share of total cross-border purchases rises from 27% to 31% in the third quarter. This is mainly due to more purchases in the DIY/Garden, Home & Living and Toys categories. By contrast, the United States loses 2 percentage points in the share of online cross-border purchases.
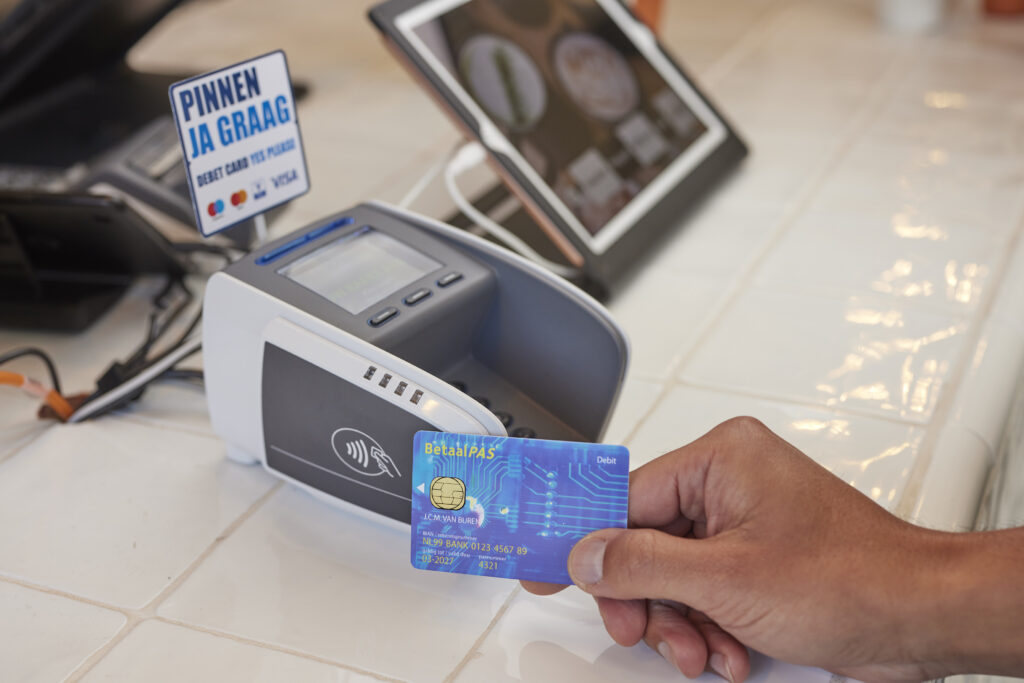
iDEAL remains stable, credit card decreases slightly
The share of iDEAL remains the same at 71%. Credit card use decreases slightly, from 10% to 8%. This decrease is especially visible in the Food/Nearfood, DIY/Garden, Home & Living, and for Loose Flight Tickets and Accommodations sectors.
Fewer online purchases in summer, growth expected in Q4
Every year, the summer months bring a quieter period in the online market. People are on holiday or going out more often, which means they shop less online. As a result, the share of online spending falls in Q3. About 22% of the total annual amount is spent in this period.
Thuiswinkel.org says: “In the last months of the year, this picture reverses again. With the start of the holiday season, we expect a clear growth in the number of online purchases and the total amount spent.”
Want to read more about developments in e-commerce or delve deeper into the data? Members of Payments Association Netherlands get the report and access to the dashboard via their InfoNet account. To do so, go to Login – InfoNet (betaalvereniging.nl)(opens in new window) . The report can be downloaded via the ‘Explanation dashboard’ page. Please note that access to this dashboard requires logging in with an Infonet account and corresponding password.
Related articles
-
Stakeholder Forum looks (far) ahead
-
News
-
European legislation
-
-
DNB presents ‘Payments Strategy’ until 2028
-
News
-
Availability and disruptions
-
-
Arjan Bol on Radio 5 about deferred card payments
-
News
-
Availability and disruptions
-
-

Scams tap into migration of iDEAL to Wero
-
News
-
Online payments
-
-

Stablecoins: ‘protecting and participating’
-
News
-
Crypto
-
-

New agreements should improve access to business checking account
-
News
-
Special accounts and services
-