
Number of online purchases stabilises as online spending rises
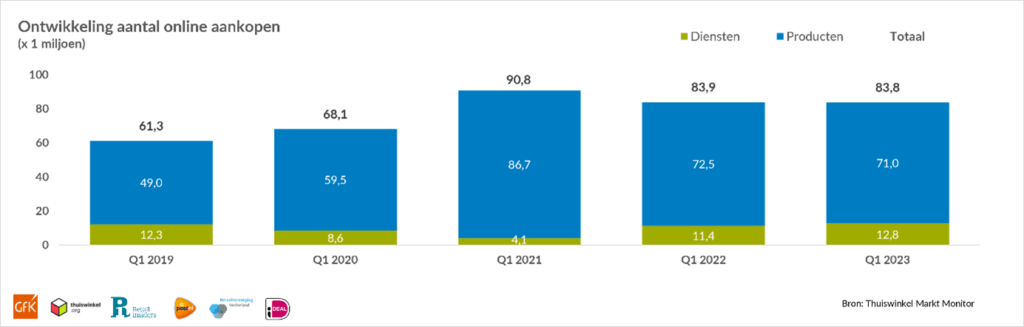
Dutch consumers spent more than €8.5 billion online in the first quarter of 2023, an increase of 5% compared with Q1 2022. The number of purchases remained unchanged: as in 2022, 84 million online purchases were made in the first quarter of 2023. Average spending per online purchase therefore rose to €102. These are the latest figures from the Thuiswinkel Markt Monitor, the survey of online consumer spending in the Netherlands. The survey is conducted by GfK on behalf of Thuiswinkel.org and Retail Insiders, in partnership with PostNL, Currence and the Dutch Payments Association.
Decline in online purchases comes to a halt
It is notable that the number of online purchases in Q1 2023 was the same as in the corresponding quarter last year. In 2022, the number had still fallen compared with the previous year (-5%), so that decline did not continue in 2023. “Looking at the trend in purchases over recent years, we see that 2021 was a peak year for e-commerce, naturally due to the forced closure of physical shops that year. The decline in 2022 was expected, because shops had largely reopened. In Q1 2023, the number of online purchases stabilised. Figures later this year will show whether this stabilisation continues,” says Marlene ten Ham, Managing Director of Thuiswinkel.org.
Major differences between products and services
There is a clear difference between products and services within the total number of purchases. The number of services purchased online continued to rise (+12% compared with Q1 2022), while the number of products purchased online fell slightly (-2%). The same trend was visible in 2022 (+49% for services and -10% for products compared with 2021), but the differences were less pronounced this year. This also appears to indicate stabilisation.
There are also differences between product categories. Purchases in the DIY/Garden category rose sharply in Q1 2023 compared with the previous year (+15%). This may be because people are doing more home improvement work themselves instead of outsourcing it, in order to save money.
Another notable category is Food/Nearfood. After several years of growth in online purchases—the category grew by 3% in 2022 compared with 2021—the first decline was recorded this quarter (-7% compared with Q1 2022). “We see a slight decrease in both the number of online buyers and the number of online Food/Nearfood purchases. Consumers who became accustomed to ordering groceries online appear to have continued doing so, but online supermarkets are attracting fewer new customers,” Ten Ham says.
Buying tickets and travel online remains popular
The services sector continues to grow. Both online purchases and online spending increased for tickets to attractions and events (+22% and +25%, respectively), package holidays (+15% and +24%) and individual airline tickets and accommodation (+8% and +22%). This trend had already begun in 2022. Ten Ham: “This can be seen as an effect of the pandemic. People in the Netherlands are no longer afraid that their holiday or event will be cancelled, and this is reflected in their choices: they are spending increasingly more on services online. We see this across the market, and price increases also play a role. Comparing 2023 with 2019, before the pandemic, services are now purchased online more often. The online share of total spending on services rose from 82% in Q1 2019 to 88% in Q1 2023, while the share of purchases made online rose from 83% to 89%.”
A notable development in the services sector this quarter was the decline in insurance purchases and spending. The number of purchases fell by 22% and online spending by 11%. Earlier research showed that at the end of 2022 people more often opted for a voluntarily higher excess, took out fewer supplementary policies and more often chose a policy from a lower-cost label rather than a main brand. The online share of insurance purchases nevertheless increased: 78% of policies were taken out online in Q1 2022, compared with 79% this year. “Comparison websites make it easy to compare insurance policies and take one out immediately. People in the Netherlands are trying to save on insurance, and arranging it online provides a solution,” Ten Ham says.
Related articles
-
A2A payments continue to grow
-
News
-
Online payments
-
-
Dutch abroad pay most with cards in Spanish hospitality
-
News
-
Card payments
-
-

High confidence in Dutch payment system
-
News
-
Card payments
-
-
Next Phase of iDEAL Migration to Wero Begins in October
-
News
-
Online payments
-
-

Lower travel spending is putting pressure on overall online spending
-
News
-
Online payments
-
-

The Digital Euro and Stablecoins: Apples and Oranges
-
News
-
European legislation
-