
Online consumer spending grows by 4% to €5.7 billion in Q3
Following the sharp increase in the second quarter of 2020, online consumer spending and online purchases also grew in the third quarter compared with the same period a year earlier.
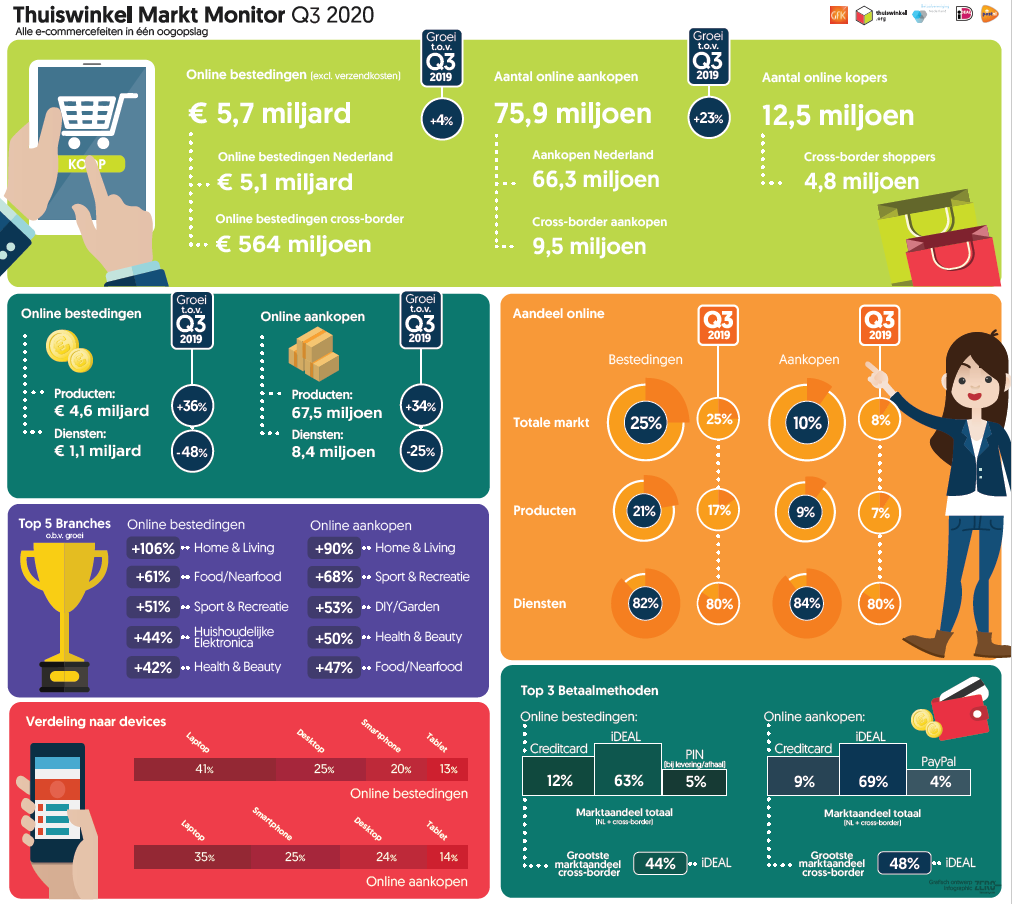
Growth in online spending and purchases was somewhat more moderate than in the second quarter, at 4% (to €5.7 billion) and 23% (to 75.9 million) respectively. These figures come from the latest Thuiswinkel Market Monitor, the study of online consumer spending in the Netherlands. GfK conducts the study on behalf of Thuiswinkel.org and Retail Insiders , in cooperation with PostNL , the Dutch Payments Association and Currence .
As in the first two quarters of the year, the increase was entirely attributable to growth in online spending on products and the number of online product purchases, up 36% and 34% respectively. Services continued to show a sharp decline. The fall in online spending on services remained at roughly the same level as in the second quarter of 2020, at -48% compared with -45% in Q2. The decline in the number of service purchases eased somewhat, to -25% compared with -35% in the second quarter.
Services sector still in the red
“The third quarter shows a similar trend to the second, but the easing of government measures during the summer is also visible,” says Wijnand Jongen, CEO of Thuiswinkel.org. “Growth in online spending on and purchases of products remained high, but consumers also bought more in physical shopping streets again. The cautious easing of restrictions in the travel and leisure sectors also slowed the decline in purchases there to some extent. It was not enough to produce positive figures: the COVID-19 crisis meant fewer people went on holiday, while those who did generally spent less on their trip, for example by choosing cheaper holidays because of the circumstances.”
As in the previous quarter, Tickets for Attractions and Events, Individual Airline Tickets and Package Holidays remained in negative territory. Online spending on package holidays fell by 77% compared with the third quarter of 2019, while spending on individual airline tickets and accommodation declined by 41%.
More online shoppers
Products, by contrast, once again showed strong growth. As in the second quarter, online spending recorded unprecedented increases in Home & Living (+106%), Food/Nearfood (+61%) and Sport & Recreation (+51%). Online penetration in some of these categories doubled, meaning that many more people in the Netherlands began buying products in these categories online. Compared with the same period a year earlier, around 760,000 new online shoppers were added in total, an increase of 7%. COVID-19 played a major part: in the third quarter of 2019, the number of online shoppers had remained virtually unchanged year on year.
Nearly half of online shoppers bought via a smartphone, while iDEAL grew again
Almost half (45%) of online shoppers bought something using a smartphone in the third quarter of 2020. This was a sharp increase from 38% in the same period a year earlier.
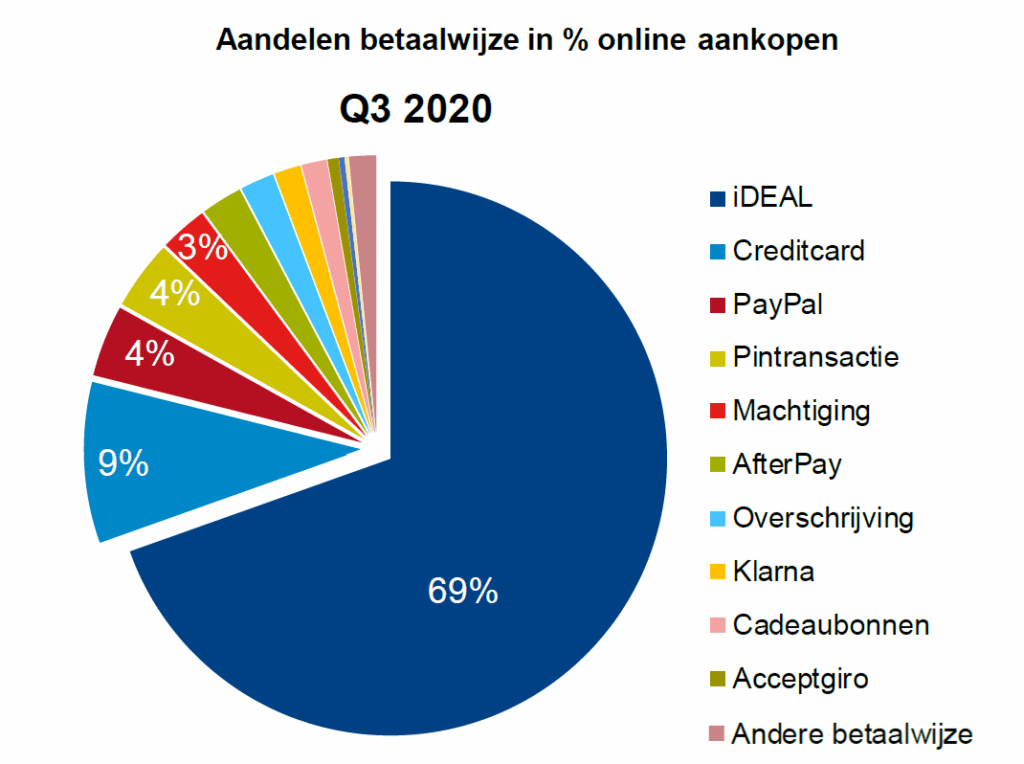
The share of iDEAL as a payment method for online purchases rose again, from 61% in the third quarter of 2019 to 69% in Q3 2020. It is also notable that iDEAL was the most popular payment method for cross-border purchases, possibly because popular foreign retailers such as AliExpress and Amazon also offered it.
Related articles
-

Pay-by-Bank, what is it?
-
News
-
Online payments
-
-
A2A payments continue to grow
-
News
-
Online payments
-
-
Dutch abroad pay most with cards in Spanish hospitality
-
News
-
Card payments
-
-

High confidence in Dutch payment system
-
News
-
Card payments
-
-
Next Phase of iDEAL Migration to Wero Begins in October
-
News
-
Online payments
-
-

Lower travel spending is putting pressure on overall online spending
-
News
-
Online payments
-