Online retail spending up 5% in Q3 2024, number of online purchases stable
Dutch consumers spent €7.8 billion online in the third quarter of 2024, a 5% growth compared to last year. The increase is due to a higher average purchase amount; the number of online purchases remains stable at 83 million. This is according to the latest figures from the Thuiswinkel Markt Monitor, the research into online consumer spending in the Netherlands. This research is conducted by GfK on behalf of Thuiswinkel.org and Retail Insiders and in cooperation with PostNL and the Dutch Payments Association.

Services again driving growing spending
The growth in online spending is especially visible within the services sector, where an increase of 8% is realised. Insurance has the largest growth ( 32%). More online purchases of insurance were also registered ( 8%). In particular, more was spent on non-life insurance, especially home and contents insurance. This is not unexpected as we see that the mortgage market is also growing strongly.
Spending in the category Tickets for Attractions & Events ( 20%) also increased, as did purchases ( 5%). Marlene ten Ham, Managing Director at Thuiswinkel.org, explains: “The growth in this category can be explained by the drier months of July and August compared to last year. As a result, we went out more. The majority of tickets are still bought online (80%), but it is noticeable that the online share has decreased. So consumers bought their tickets more often physically instead of online compared to last year.”
Large differences in spending between product categories
Online spending on products shows slight growth ( 3%), with increases in categories such as Telecom ( 23%) and DIY/Garden ( 12%). The biggest decreaser is Media & Entertainment (-16%). This industry typically shows an erratic pattern in online spending. In 2023, sales of the PlayStation 5 went very strong, leading to higher than average spending on Media & Entertainment. By contrast, in 2024, spending is down again, possibly explained by reduced demand for the PlayStation 5, as well as for associated games and accessories.
Cross-border online shopping continues to grow
The number of cross-border purchases is increasing, from 11% to 13% of total online purchases. Cross-border spending also continues to grow, from 12% to 14% of total online spending. The biggest growth came from categories Food/Nearfood, Clothing and Tickets for Attractions & Events. China continues to lead in the number of cross-border purchases, 27% of cross-border purchases are at Chinese online shops. For spending, Germany is in first place (23%).
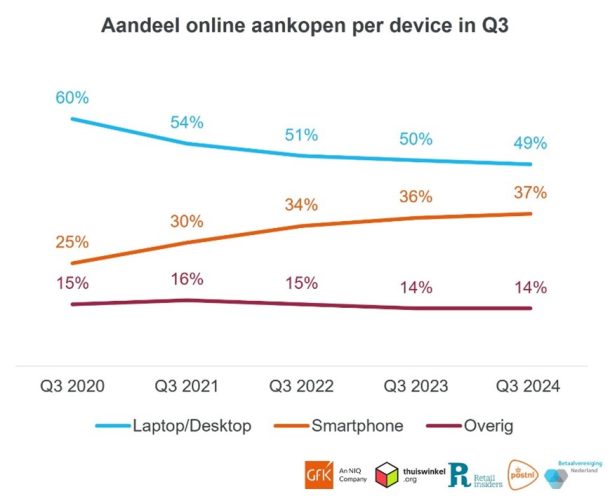
Growth in smartphone purchases
Although desktop and laptop remain the most popular devices for online shopping (with a 49% share), the smartphone’s share of online purchases grew slightly, from 36% to 37%. Growth in smartphone purchases has been visible for several years, although the growth rate has been slowing down. Among others, the Health & Beauty and Clothing categories are driving this growth.
Slight decline in iDEAL, increase in use of credit cards
at 71%, iDEAL remains the most used payment method, but its share declined slightly: in Q3 2023, 73% of online purchases were still paid with iDEAL. The share of iDEAL is falling for both domestic and cross-border purchases. The use of credit cards is rising, from 8% to 10%. The cross-border share of PayPal and Klarna increases (from 8% to 10% and 7% to 9% respectively).
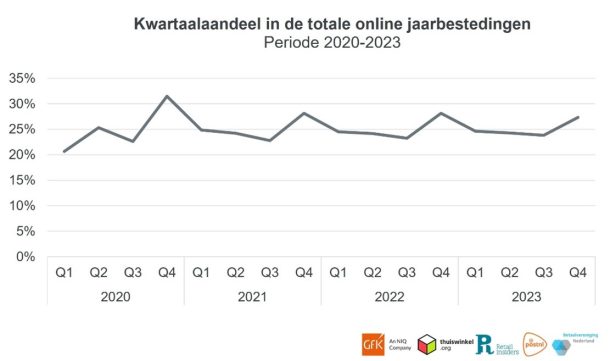
Fewer online purchases in summer, growth expected in Q4
Traditionally, Q3, the warmest period of the year in the Netherlands, is not the most popular season for online purchases. On average, only 22% of the annual amount spent online is spent in this period. Marlene ten Ham: “In the third quarter, we spend more time outdoors and shop physically more often than online. Based on trends from previous years, we expect a big increase in online spending in the fourth quarter, partly thanks to the holidays.”
Want to read more about developments in e-commerce or delve deeper into the data? Members of Payments Association Netherlands get the report and access to the dashboard via their InfoNet account. To do so, go to Login – InfoNet (betaalvereniging.nl) . The report can be downloaded via the ‘Explanation dashboard’ page. Please note that access to this dashboard requires logging in with an Infonet account and corresponding password.
Related articles
-
Next Phase of iDEAL Migration to Wero Begins in October
-
News
-
Online payments
-
-

Lower travel spending is putting pressure on overall online spending
-
News
-
Online payments
-
-

The Digital Euro and Stablecoins: Apples and Oranges
-
News
-
European legislation
-
-
Banks are calling out social media platforms for their role in fraud and scams
-
News
-
Online payments
-
-

First online lunch session updates members on current developments in the payments sector
-
News
-
European legislation
-
-

René Steenbeke nominated by EPC to the EPSG Cryptography Task Force
-
Association news
-
Standards in payment transactions
-