More online product purchases, less spending on travel and events in 2025
Dutch consumers spent €35.7 billion online in 2025, a 1% decrease compared to 2024. The number of online purchases is 347 million, the same as in 2024. 13% of online spending and purchases goes to foreign webshops, amounting to €4.5 billion (+2% compared to 2024) and 45 million purchases (+9%). This is evident from the latest figures from the Thuiswinkel Markt Monitor, the study on online consumer spending in the Netherlands. This study is conducted by NielsenIQ on behalf of Thuiswinkel.org and Retail Insiders and in collaboration with PostNL and the Dutch Payments Association.

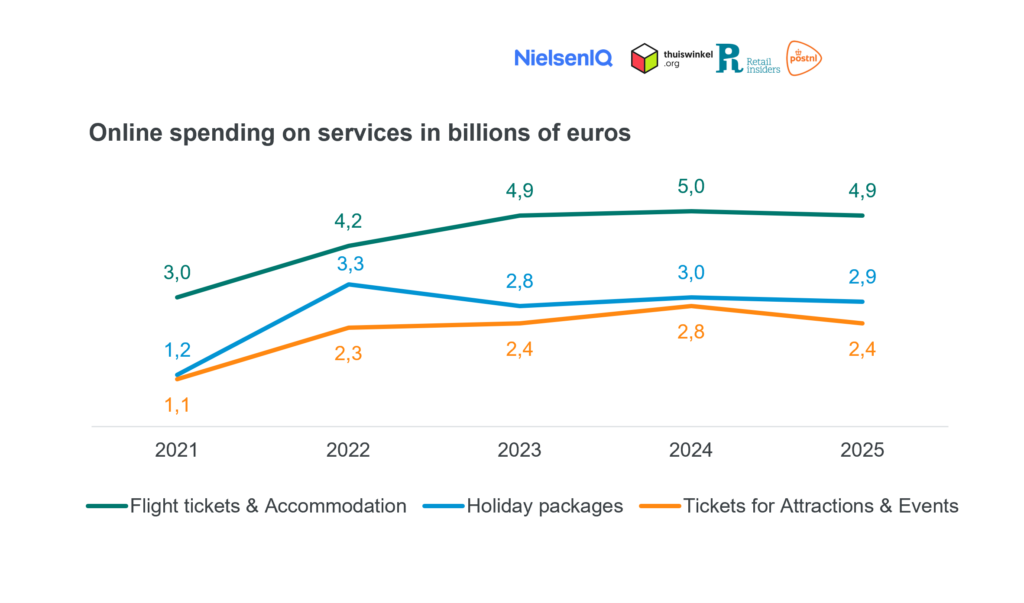
Service sector shrinks for the first time since 2021
For the first time since 2021, the service sector is showing a decline, both in online purchases (-11%) and spending (-5%). Tickets for attractions and events have seen the sharpest decline in both spending (-12%) and the number of purchases (-14%). Concerts, festivals, and sporting events, in particular, have seen a decline compared to previous years.
Online purchases are also declining in the travel categories. Spending on individual airline tickets and accommodations is down by 2%, and package tours by 4%. The number of purchases is falling more sharply, by 9% and 8%, respectively.
“After several years of growth, we are seeing demand for services cool off somewhat. This is not limited to online spending, as total spending on services is declining at the same rate,” says Marlene ten Ham, managing director of Thuiswinkel.org.
Growth in online purchases of products
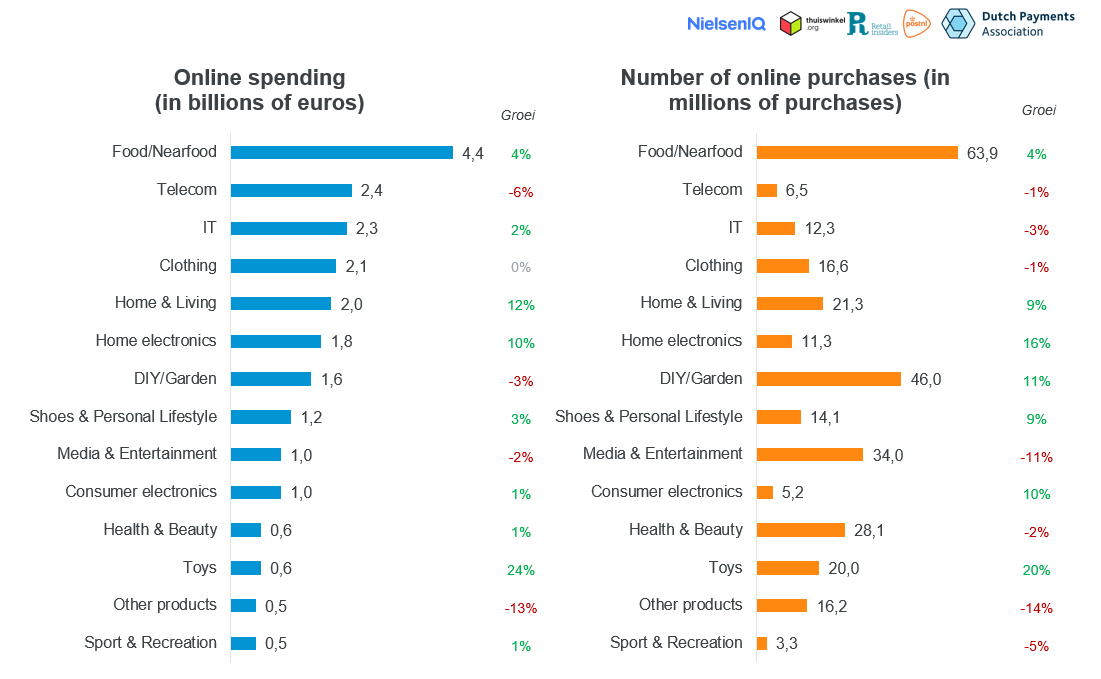
Online spending on products continues to grow (+2%). Home & Living (+12%), Home Electronics (+10%), and Food & Nearfood (+4%) are the main contributors to this growth. Toys also show a strong increase (+24%).
After several years of decline, the number of online product purchases is growing again (+2%). The DIY & Garden (+11%) and Home Electronics (+16%) categories, in particular, are showing a clear increase.
Growth in cross-border purchases continues, China strengthens its leading position
The growth in online purchases from foreign web shops continues. In 2025, the number of cross-border purchases rose to 44.8 million (+9%). Total cross-border spending amounted to €4.5 billion (+2%). In 2021, these figures were 35.5 million and €2.9 billion, respectively.
Just as with purchases within the Netherlands, this growth over the past year has been driven by products. The DIY & Garden, Shoes & Personal Lifestyle, and Home & Living categories, in particular, show strong growth in cross-border purchases. For example, in 2021, 8% of our purchases in the Home & Living category were made abroad, compared to 17% in 2025. Spending on this category abroad is also growing, from 8% to 13%.
Dutch consumers still most frequently shop at Chinese online stores when making purchases abroad. With 31% of all cross-border purchases, China is strengthening its leading position compared to 2024, when 28% of cross-border purchases were made there. The United States (from 12% to 9%) and the United Kingdom (from 7% to 6%) are losing ground.
“Consumers are increasingly finding their way to foreign online stores, especially for products,” says ten Ham. “At the same time, the strong growth of Chinese online stores shows how important it is that consumers know what they are buying and that we ensure everyone selling adheres to the same European quality and safety regulations.”
Smartphones increasingly important for online purchases
Smartphones are playing an increasingly significant role in online shopping. In 2025, 41% of all online purchases were made via a smartphone, an increase of 5 percentage points compared to 2024. At the same time, the share of desktop and laptop purchases fell from 49% to 45%. Ten Ham: “In the future, we expect the smartphone to become the most important device. Consumers want to be able to shop anytime, anywhere, and online stores are responding to this trend more effectively with mobile optimization and apps.”
For cross-border purchases, smartphone usage is growing at a slower pace. There, the share rises only slightly, from 35% to 36%.
iDEAL remains the most used payment method
The share of iDEAL drops from 72% to 71%, but iDEAL remains the most used payment method. Credit card usage also drops slightly from 9% to 8%. Klarna’s share is growing from 3% to 4%. Given the changes in the payment market in the coming year, it will be interesting to see how these positions evolve further. For example, iDEAL will become Wero in 2026, BNPL will be further regulated, and more and more Dutch people will receive a new debit card that also allows them to pay online.
Want to read more about developments in e-commerce or delve deeper into the data? Members of Payments Association Netherlands get the report and access to the dashboard via their InfoNet account. To do so, go to Login – InfoNet (betaalvereniging.nl)(opens in new window) The report can be downloaded via the ‘Explanation dashboard’ page. Please note that access to this dashboard requires logging in with an Infonet account and corresponding password.
Related articles
-
Next Phase of iDEAL Migration to Wero Begins in October
-
News
-
Online payments
-
-

Lower travel spending is putting pressure on overall online spending
-
News
-
Online payments
-
-

The Digital Euro and Stablecoins: Apples and Oranges
-
News
-
European legislation
-
-
Banks are calling out social media platforms for their role in fraud and scams
-
News
-
Online payments
-
-

First online lunch session updates members on current developments in the payments sector
-
News
-
European legislation
-
-

René Steenbeke nominated by EPC to the EPSG Cryptography Task Force
-
Association news
-
Standards in payment transactions
-