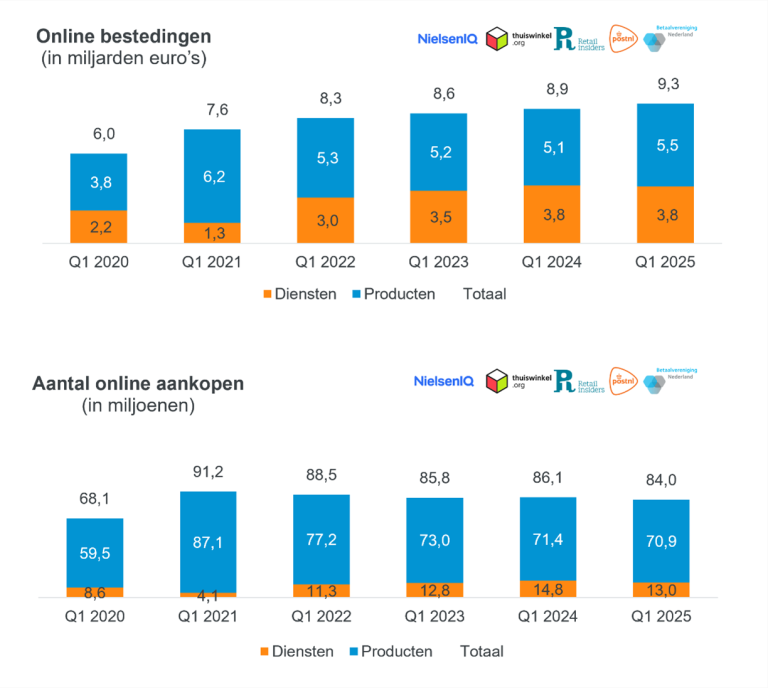
Growth in online product spending for the first time in years
Dutch consumers spent over €9 billion online in Q1 2025, a growth of 4% compared to Q1 2024. This growth comes mainly from spending on products ( 8%), spending on services showing a 2% decline. The number of purchases in Q1 is 84 million (-3% vs Q1 2024). In line with spending, the number of purchases of services is also falling sharply (-12%). The number of online product purchases also decreases slightly (-1%). The average amount spent per online purchase increases by 6% to €110, according to the latest figures from the Thuiswinkel Markt Monitor, the research into online consumer purchases in the Netherlands. The research is conducted by NielsenIQ (NIQ), commissioned by Thuiswinkel.org and Retail Insiders and in cooperation with PostNL and the Dutch Payments Association.

Growth online spending on products mainly driven by Home & Living
Online spending on products shows growth again for the first time since the corona pandemic. This is remarkable, because in recent years, online spending actually decreased, although it remained higher than before the corona pandemic (see Figure 1). The growth in products is mainly driven by a strong increase in the Home & Living category ( 46%). Consumers mainly spent more on cooking and kitchen utensils, household textiles and kitchen appliances. “Spending on Home & Living showed a clear shift from offline to online. The online share of spending increased from 24% in Q1 2024 to 36% in Q1 2025. In addition, a strong increase in the average amount spent contributes to the online growth of the Home & Living category,” explains Marlene ten Ham, Managing Director at Thuiswinkel.org.
The number of purchases of the Home & Living category also increased ( 2%), but less rapidly than spending. We do see a sharp increase in the toys category ( 28%). Especially action figures, games, puzzles and construction sets (such as LEGO) are experiencing strong growth in online purchases. Ten Ham: “We see that consumers are increasingly buying these categories online. Especially for Home & Living, this is not unexpected, considering a chain like Blokker, for example, disappeared from the scene last year.” The growth in online purchases in these categories is offset by declines in Media & Entertainment (-18%) and DIY & Garden (-12%), leading to a slight decrease in online purchases overall (-3%).
Declines in services, especially in Insurance and Tickets for Attractions & Events
Online spending on services falls by 2%, mainly due to a sharp decline in Insurance (-12%). Within this, spending on health insurance falls, while non-life and life insurance show a slight increase. Online purchases of services decline sharply by -12%. This decrease is partly caused by a sharp decline in Tickets for Attractions & Events (-16%).
Online share of products grows
Within total retail spending, the online share increased by 2 percentage points from 31% to 33%. This increase is entirely driven by products, where the share online grew from 21% to 23%. The share online within services remains stable at 88%. Ten Ham: “The growing online share in products and continuing high share in services underlines how indispensable e-commerce is in the Dutch retail landscape. Online shopping has long since ceased to be an addition to physical retail, but a full and structural part of how consumers orientate, compare and buy whether or not in combination with the physical shop.”
Rise in online cross-border spending, loss for US-based webshops
In the first quarter of 2025, online cross-border spending increased by 6% compared to the same period last year, to €1.2 billion. Spending increased only for products ( 17%), not for services (-3%).
The number of online cross-border purchases is also up 6%, again with a clear distinction between products and services. Purchases of products from foreign online shops. are up 9%, those of services are down 11%.
The United States is losing the largest share within cross-border spending. The share of US webshops fell from 12% in the first quarter of 2024 to 8% in the first quarter of 2025. Ten Ham says: “The decline in spending at US webshops is linked to broader geopolitical and economic developments. At a time when trade barriers, import duties and the public debate about a possible trade war are flaring up, consumers are becoming more cautious. European online shops then offer not only convenience, but also certainty about delivery times, costs and consumer rights.”
Smartphone use increases, payment behaviour remains largely stable
Smartphone use in online shopping continues to increase. Meanwhile, 39% of all online purchases are made via smartphone ( 4 percentage points). The share of spending via smartphones is also rising, from 27% to 30%. “The smartphone is no longer an afterthought in online shopping: it is overtaking the laptop as the preferred channel.”
The use of iDEAL has decreased slightly, from 73% in Q1 2024 to 71% in Q1 2025. Klarna’s share actually increased slightly, from 3% in Q1 2024 to 4% in Q1 2025.
Want to read more about developments in e-commerce or delve deeper into the data? Members of Betaalvereniging Nederland get the report and access to the dashboard via their InfoNet account. To do so, go to Login – InfoNet (betaalvereniging.nl) . The report can be downloaded via the ‘Explanation dashboard’ page. Please note that access to this dashboard requires logging in with an Infonet account and corresponding password.
Related articles
-

The Digital Euro and Stablecoins: Apples and Oranges
-
News
-
European legislation
-
-
Banks are calling out social media platforms for their role in fraud and scams
-
News
-
Online payments
-
-

First online lunch session updates members on current developments in the payments sector
-
News
-
European legislation
-
-

René Steenbeke nominated by EPC to the EPSG Cryptography Task Force
-
Association news
-
Standards in payment transactions
-
-

More online product purchases, less spending on travel and events in 2025
-
News
-
Online payments
-
-

Stakeholder Forum looks (far) ahead
-
News
-
European legislation
-