
Online spending rises 9% to €16.1 billion in first half of 2022
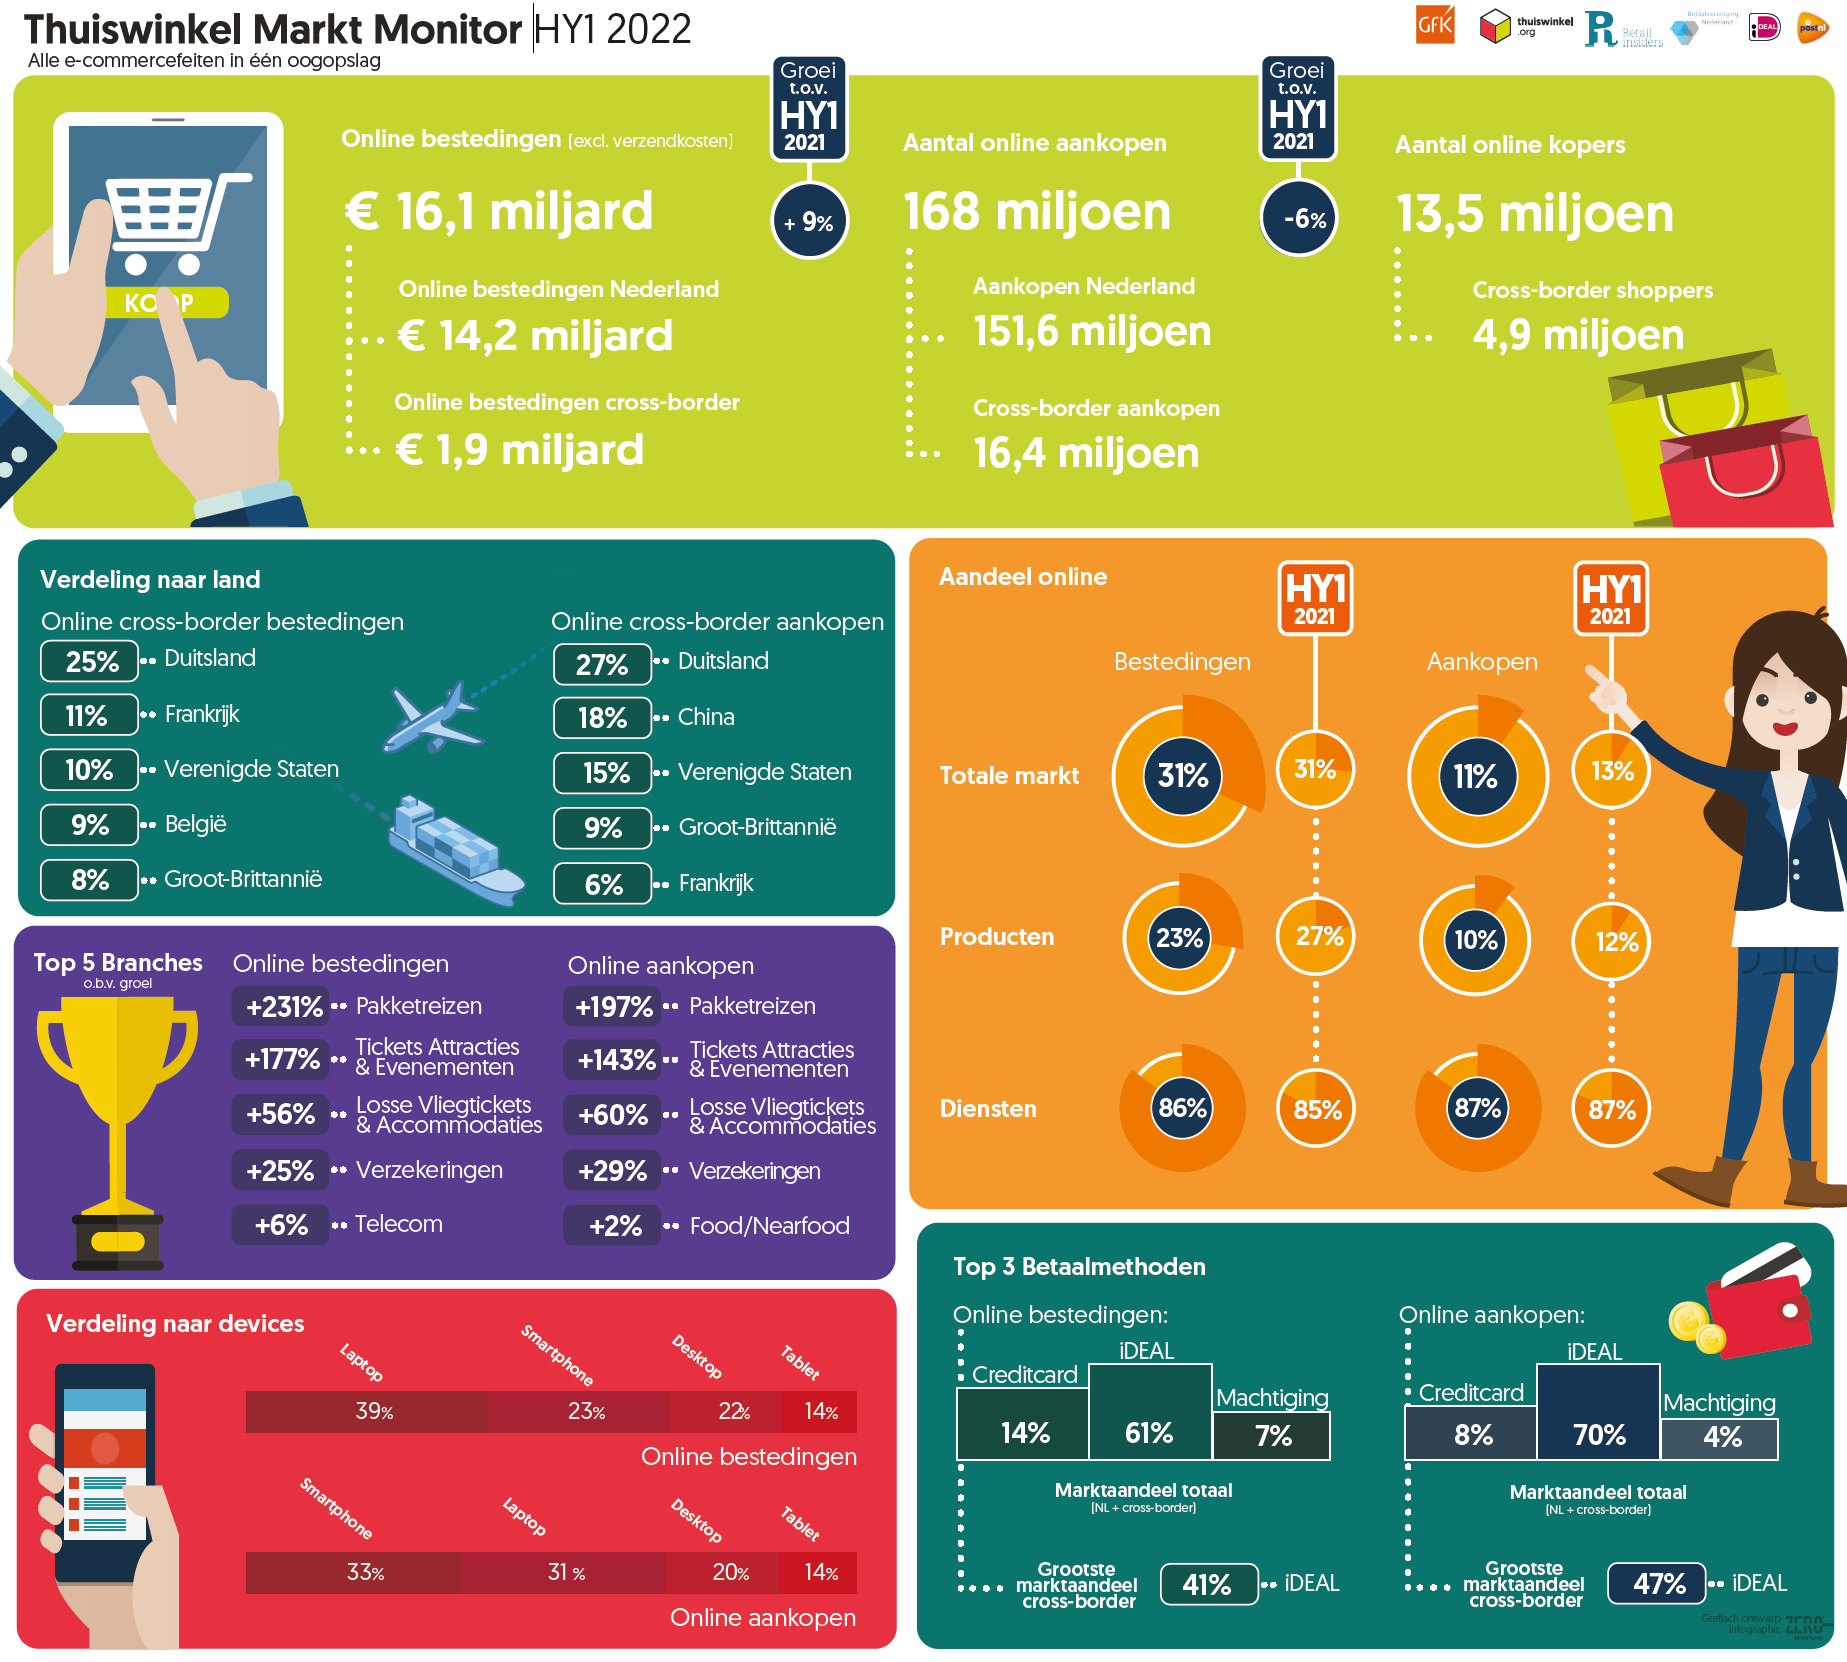
Dutch consumers spent €16.1 billion online in the first half of 2022, an increase of 9% compared with the same period a year earlier. Growth was driven by a sharp rise in spending on services (+86%). Online spending on products also remained above pre-pandemic levels, although it fell by 11% compared with the same period a year earlier. These findings come from the latest figures from the Thuiswinkel Markt Monitor, a study of online consumer spending in the Netherlands. GfK conducts the study on behalf of Thuiswinkel.org and Retail Insiders , in cooperation with PostNL, Currence and the Dutch Payments Association.
“The strong growth in services is mainly due to the increase in sales of tickets for events and theme parks, as well as package holidays and airline tickets. Online ticket purchases in Q2 almost doubled compared with the same period a year earlier. There is a clear correlation with six months without coronavirus restrictions,” said Marlene ten Ham, Director of Thuiswinkel.org.
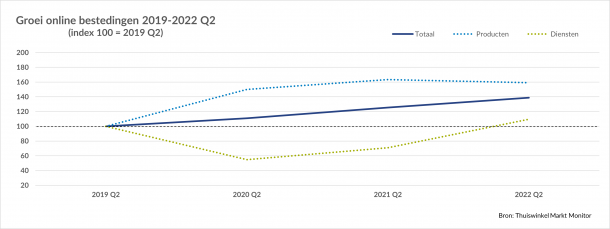
Spending on services exceeds pre-pandemic level in Q2 2022
Following the various lockdowns and coronavirus-related restrictions, consumers had a more positive outlook at the end of 2021 and a cautious rise in purchases of services was recorded. The growth seen in the first quarter of 2022 continued, though to a lesser extent, in the second quarter. Online spending in the Package Holidays (+129%) and Tickets for Attractions & Events (+104%) categories more than doubled compared with Q2 2021. Consumers made online purchases in these categories more often and also spent more on average. Total spending on services exceeded its pre-pandemic level (Q2 2019: €2.3 billion; Q2 2022: €2.5 billion).
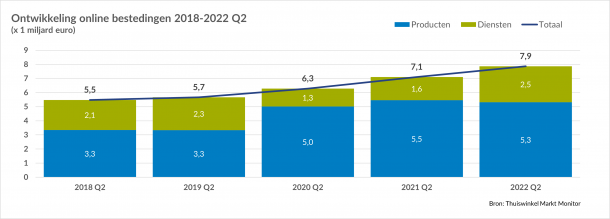
Products remain above pre-pandemic level
A total of 168 million purchases were made online in the first half of the year. Online product purchases declined year on year in both Q1 and Q2, when physical retail reopened fully (-14%). Nevertheless, online product spending of €5.3 billion remained above the pre-pandemic level. Ten Ham said: “Consumers have become accustomed to shopping online. They are increasingly combining online and offline purchases again. Food and near-food products are the main exception to the decline. Online grocery shopping remains popular.”
Smartphone use for online shopping continues to grow
One in three online purchases in the first half of the year was made using a smartphone. Smartphones were used most often for Food/Near-food, Tickets for Attractions & Events and Clothing. Desktop and laptop computers remained the most important devices for online purchases, with a share of 51%, but their share falls by a few percentage points every six months, including four percentage points compared with a year earlier.
Use of iDEAL stable, with rise in smartphone purchases
As in previous years, most purchases were paid for with iDEAL (70%), followed at some distance by credit cards (8%). However, a larger share of smartphone purchases was paid for with iDEAL in the first half of 2022: 72%, compared with 68% in the first half of 2021. This was mainly due to the increased use of iDEAL in the Food/Near-food segment.
Thuiswinkel Markt Monitor infographic: Q2 2022
Thuiswinkel Markt Monitor infographic: first half of 2022
Related articles
-

High confidence in Dutch payment system
-
News
-
Card payments
-
-
Next Phase of iDEAL Migration to Wero Begins in October
-
News
-
Online payments
-
-

Lower travel spending is putting pressure on overall online spending
-
News
-
Online payments
-
-

The Digital Euro and Stablecoins: Apples and Oranges
-
News
-
European legislation
-
-
Banks are calling out social media platforms for their role in fraud and scams
-
News
-
Online payments
-
-

First online lunch session updates members on current developments in the payments sector
-
News
-
European legislation
-